Loading [Contrib]/a11y/accessibility-menu.js
CCGP Journal
  • Menu
  • Articles
    • Book Review
    • Regular Article
    • Research Article
    • Research Articles
    • Research Communication
    • All
  • For Authors
  • Editorial Board
  • About
  • Issues
  • Blog
  • WOCA Conference
  • search

    Sorry, something went wrong. Please try your search again.
    ×

    • Articles
    • Blog posts

RSS Feed

Enter the URL below into your favorite RSS reader.

https://ccgpjournal.org/feed
×
Research Article
September 09, 2022 EDT

Gadolinium enrichment in association with the magnetic fraction of fly ash: Real or an illusion?

James Hower, John Groppo, Dali Qian, Nicolas Briot, Tonya Morgan, Shelley Hopps, Elizabeth Cantando,
lanthanides coal fly ash electron microscopy Kentucky
• https://doi.org/10.4177/001c.34170
Photo by Abigail Ducote on Unsplash
CCGP Journal
Hower, James, John Groppo, Dali Qian, Nicolas Briot, Tonya Morgan, Shelley Hopps, and Elizabeth Cantando. 2022. “Gadolinium Enrichment in Association with the Magnetic Fraction of Fly Ash: Real or an Illusion?” Coal Combustion and Gasification Products, September. https://doi.org/10.4177/001c.34170.
Save article as...▾
  • PDF
  • XML
  • Citation (BibTeX)
Data Sets/Files (10)
Download all (10)
  • Table 1. Chemistry of beneficiated fly ash fractions
    Download
  • Figure 1. Upper continental crust-normalized rare earth elements (REE; after McLellan & Taylor, 1991) for feed ash and beneficiation products of Plant I/run 24 fly ash.
    Download
  • Figure 2. Fly ash particle 1714 and 1724 on lacey carbon film.
    Download
  • Figure 3. Element maps of Ce (left) and Gd (right) for particle 1714.
    Download
  • Figure 4. Energy dispersive spectroscopy (EDS) spectrum for Area 1 in Figure 3.
    Download
  • Figure 5. Energy dispersive spectroscopy (EDS) spectrum for particle 1714.
    Download
  • Figure 6. High-angle annular dark-field scanning transmission electron microscopy (HAADF-STEM) image of particle 1724 with element maps of Al, Si, Fe, Ce, and Gd.
    Download
  • Figure 7.
    Download
  • Figure 8. Energy dispersive spectroscopy (EDS) spectrum for particle 1724.
    Download
  • Figure 9. Example of the complexities of elemental mapping showing the P, Ce, Si, and Y distributions in a rare earth element–bearing mineral (mz)/kaolinite/coal mix from the Fire Clay coal (unpublished data from a 2019 re-examination of the samples studied in Hower et al. 2018).
    Download

Sorry, something went wrong. Please try again.

If this problem reoccurs, please contact Scholastica Support

Error message:

undefined
×

View more stats

Abstract

Gadolinium, and possibly praseodymium, are relatively enriched in the magnetic fractions of Class F fly ashes from Central Appalachian coal sources. Although the enrichment is evident in the inductively coupled plasma–atomic emission spectroscopy (ICP-AES) determinations of the rare earth content, transmission electron microscopy–energy dispersive x-ray spectroscopy (TEM-EDS) examination of the fly ash fails to show the sites of the Gd or Pr. This apparent lack of correlation could be due to the inability of the EDS to detect low concentrations of the rare earth elements definitively; interferences in the analytics, leading to false positives in the chemical analysis; or the overlap of the energies of Gd and/or Pr with more abundant elements, leading to inaccurate negative results.

1. Introduction

Investigations of the rare earth element (REE) composition of fly ashes has demonstrated that Gd (and, perhaps, Pr) are partitioned within size and sequential-extraction fractions (Lin et al. 2018; Pan et al. 2018, 2019; Wang et al. 2019; Park et al. 2021; Fu et al. 2022) and that they have an enhanced concentration in the magnetic fraction of the beneficiation products (Hower et al. 2017, 2020, 2021; Hower and Groppo 2021). This enrichment is counter to the diminished concentrations of the remainder of the lanthanide suite in the magnetic fraction relative to the feed ash and to the other beneficiation products. Although we can observe the apparent association (co-occurrence) of Gd and Pr with the magnetic, Fe-rich fraction based on the bulk chemical analyses, no previous studies demonstrated the mode of the association of the REE.

The magnetic fraction of fly ashes is dominated by spinel minerals, including magnetite, with associated Al-Si glass and carbons (Hower 2012). The latter spinel/glass/carbon association is at the microns to tens-of-microns scale, a finer scale than that approachable with conventional (and economic) beneficiation schemes. REE and other metals are known to occur within carbons on the surface of spinels and glass (Veranth et al. 2000; Chen et al. 2004; Chen, Shah, Huggins, and Huffman 2005; Chen, Shah, Huggins, Huffman, et al. 2005; Linak et al. 2007; Hower et al. 2008, 2017; Silva et al. 2010, 2012; Ribeiro et al. 2013; Wilcox et al. 2015; Yang et al. 2017; Fu et al. 2018; Hower and Groppo 2021).

In this study, we employ transmission electron microscopy (TEM) to analyze the occurrence and association of REE in the magnetic fraction of fly ash further.

2. Methods

2.1. Sampling and chemical analysis

The original 12-ton fly ash sample was obtained from Kentucky Plant I (letter code used to anonymize the source power plant) by the University of Kentucky’s Center for Applied Energy Research (CAER) in July 2018. The beneficiated magnetic fraction is from run 42 (produced in November 2018) of the CAER’s pilot-scale processing of the fly ash (Hower et al. 2020). The beneficiation and chemical analysis procedures were provided in detail in the latter publication. Of specific interest for this study, the REE were extracted from the fly ash samples by heated digestion with a 1:1 HF:HNO3 acid mixture followed by analysis by inductively coupled plasma–atomic emission spectroscopy (ICP-AES) at the CAER.

With ICP-AES, the choice of the wavelength of the emission is critical to the analyses. With multiple wavelengths possible for each analysis, the selection of the preferred wavelength was made by comparisons against standards such as the U.S. Geological Survey Brush Creek Shale (SBC-1) (Bank et al. 2016), LGC Standards Brown Coal Ash (BF BE1), and available round-robin certified samples. For Gd, the software’s generic preference was to use a wavelength of 342.246 nm. Considering the fly ash sample matrix in this sample, the wavelength of 301.013 nm was consistently in better agreement with the standards. Both wavelengths are suitably isolated to avoid potential interferences. For 301.013 nm, the nearest elements on either side of the Gd peak are Ir and Cr, and both have negligible intensities (<0.1% compared to Gd). For comparison purposes with the 342.246-nm wavelength, the nearest elements are W and Th. The Th intensity is only 0.3% compared to the Gd. For Pr, the software generic preference was to use a wavelength of 417.939 nm, which has a direct overlap with V, a significant element in the ash (Table 1). With the sample matrix we were using, the wavelength of 410.072 nm was consistently in better agreement. The 410.939-nm wavelength is sufficiently isolated with the nearest elements on either side of the Pr peak being Er and Th. Both neighboring elements had an intensity within 8% that of Pr; not negligible but certainly not reason for concern given the wavelength differential.

Table 1
Table 1.Chemistry of beneficiated fly ash fractions

Note: As-received moisture; dry ash, C, H, N, S, and O; ash-basis major oxides (%); ash-basis minor elements, including Sc, Y, and REE (ppm); total lanthanides (REE), REE + Y (REY), and REY + Sc (REYSc) (ppm; ash-basis unless indicated otherwise).

It is conceded that ICP-AES is not as rigorous as inductively coupled plasma mass spectroscopy (ICP-MS) for the heavy REE, particularly the odd-atomic-number heavy REE. For the other REE, the comparison between the methods is good (Hower et al. 2020; Ardini et al. 2010; Medvedev et al. 2018; Zygarlicke et al. 2019). As noted above, physical (such as matrix differences), chemical, and spectral interferences can impact the determination of element concentrations.

2.2. University of Kentucky electron microscopy

The sample for scanning transmission electron microscopy–energy dispersive x-ray spectroscopy (STEM-EDS) was the magnetic fraction of the fly ash, dispersed on a lacey carbon film and attached to a TEM copper grid. Imaging and EDS characterizations were performed on a FEI Talos F200X TEM operating at 200 keV at the University of Kentucky Electron Microscopy Center (http://emc.engr.uky.edu/equipment/equipment-list/transmission-electron-microscope). Fast Fourier transform (FFT) of high-resolution TEM images and selected area electron diffraction (SAED) determined the crystalline structure of the submicron grains. Atomic-contrast images (gray-level proportional to the ratio of the atomic number) were collected with a high-angle annular dark-field detector (HAADF). HAADF image intensity is indicative of chemical content. The EDS spectra in the energy range of interest (4,000–6,500 eV) were examined by plotting the data with SigmaPlot and selecting energy (eV) and count ranges for enhancement.

2.3. Virginia Tech electron microscopy

The Fire Clay coal sample was originally prepared as 2.54-cm-diameter epoxy-bound pellet prepared to a final 0.05-μm-alumina polish for petrographic examination. A slice of the pellet was used for the scanning electron microscopy (SEM) examination. For SEM, the sample was coated with carbon to prevent charging and then observed on a FEI Quanta 600 in backscatter electron (BSE) mode to find particles with high average atomic numbers. Energy dispersive spectroscopy (EDS) analyses were made on particles with high BSE intensity using a Bruker-AXS SFlash silicon drift detector. EDS analysis was conducted at 20 keV, a sufficient overvoltage to detect diagnostic energy peaks of REE and achieve a spatial resolution of approximately 1 μm, with an x-ray range of 4–5 μm.

Based on the SEM-EDS analyses, an area from an intact fragment of coal and minerals was selected for more thorough analysis. A FEI Helios 600 NanoLab Focused Ion Beam was used to extract and lift out a thin slice of the promising mineral assemblage tentatively identified by SEM. The slice was mounted on a Cu grid and ion milled to approximately 100-nm thickness. TEM was conducted on a JEOL JEM-2100 analytical electron microscope, with a LaB6 electron gun, operated at 200 keV and equipped with a JEOL 60-mm2-window silicon drift detector–based EDS system for chemical mapping at a spatial resolution of 3–20 nm. SAED was employed for mineralogical identification of grains. In conjunction with SAED and for grains too small for SAED, high-resolution TEM (HRTEM) was used for mineral identification. Lattice spacing in HRTEM micrographs was measured from the corresponding (FFT and computed in the image analysis software Gatan Digital Micrograph.

3. Results and Discussion

The chemistry of the beneficiated fractions of the Plant I/ run 42 fly ash is given in Table 1. Similar distributions were observed in other ashes by Hower et al. (2017, 2020; and in unpublished results from ongoing studies).

The expected, but nonetheless striking, difference in the major oxide chemistry between the magnetic fraction (sample 94095) and the other fractions must be a consideration in the following discussion of the microscopic (TEM) and, in particular, the bulk (x-ray fluorescence for the major oxides and non-REE/Y/Sc minor element and ICP-AES for Sc, Y, and the lanthanides) analyses. For example, the sample 94095 Fe2O3 concentration of 60.18% contrasts with 11.60% in the feed ash and 6.86% in the <200-mesh product. Similarly, there is 35.98% SiO2+Al2O3 and 1.07% Na2O+K2O in the magnetic fraction versus 85.59% and 3.28%, respectively, in the <200-mesh product. In consideration of the sample matrix of the magnetic vs. the other fractions, the major oxide analyses demonstrate that the Fe2O3-rich magnetic fraction potentially poses different matrix problems than would the feed ash and the other beneficiated fractions.

Despite having a lower REE content than the feed ash or any of the other concentrates, the magnetic fraction has a higher ash-basis Pr and Gd content than the other samples. The abnormal distribution of the REE, particularly Gd, is emphasized in the plot of the normalized upper continental crust distribution of the REE (Figure 1; after McLennan and Taylor 1991).

Figure 1
Figure 1.Upper continental crust-normalized rare earth elements (REE; after McLellan & Taylor, 1991) for feed ash and beneficiation products of Plant I/run 24 fly ash.

Because of the limitations of inductively coupled plasma–atomic emission spectroscopy, Tb and the REE elements heavier then Dy are not plotted.

3.1. Particle 1714

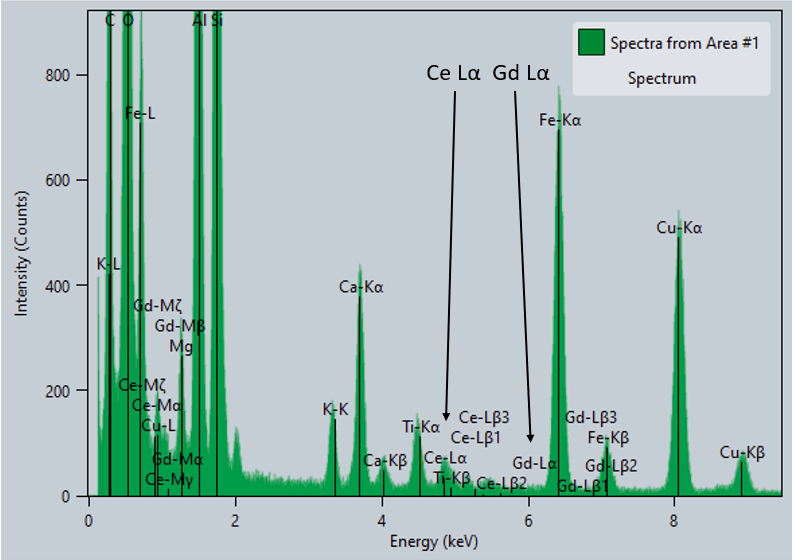
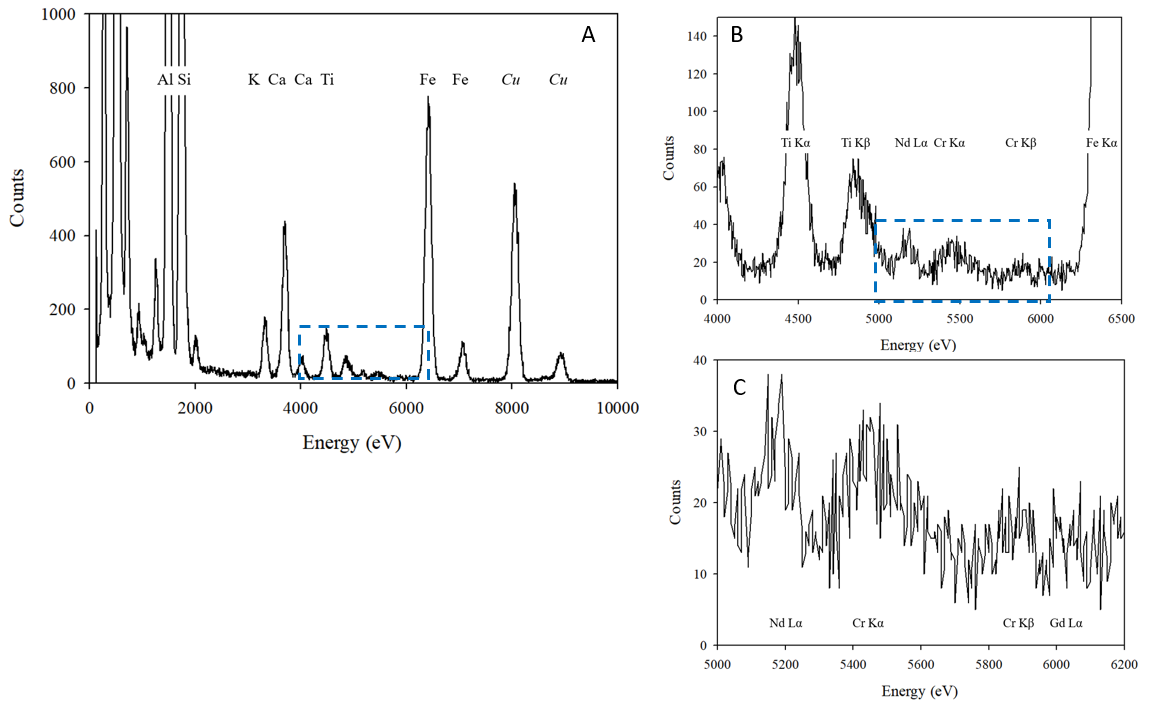
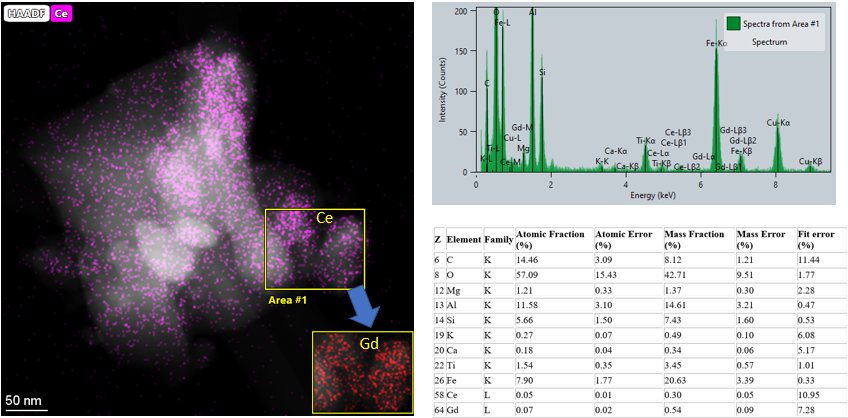
Two particles were chosen for examination by TEM (Figure 2). Particle 1714 appears to have measurable Ce and Gd contents based on the elemental maps (Figure 3). The labeled EDS spectra of the area (Figure 4), however, shows that the Ce Lα peak (4.839 keV) overlaps the Ti Kβ peak (4.933 keV) and, even with the recognition that the Lβ peak is less intense than the peak for any element heavier than potassium, the Ce Lβ (5.262 keV) does not appear to be significant. Similarly, the Gd Lα peak (6.053 keV) is not significant, the Gd Lβ1 (6.708 keV) is not significant and/or it is in the shadow of the Fe Kα peak (6.405 keV), and the Gd Lβ2 (which would have a smaller magnitude that the Gd Lα and Lβ1 peaks) overlaps with the Fe Kβ peak (7.059 keV). The full-scale EDS spectrum (1,000 counts at 10,000-eV full scale) also shows no sign of the REE; note, the Al and Si peaks exceed 1,000 counts [full data in supplementary material]; Figure 5A). A more restricted look at the EDS spectrum (150 counts in the 4,000–6,500-eV range) shows some hints of REE (Figure 5B). In this case, the Nd Lα peak (5.228 keV) appears to be significant and the Gd Lα peak might be in the unlabeled section to the right of the Cr Kβ peak. The presence of Nd and, possibly, Gd suggests that other REE may be present, just hidden in the Ti, Cr, and Fe peaks.

Figure 2
Figure 2.Fly ash particle 1714 and 1724 on lacey carbon film.

The high-angle annular dark-field scanning transmission electron microscopy (HAADF-STEM) images of each particle are on the right.

Figure 3
Figure 3.Element maps of Ce (left) and Gd (right) for particle 1714.
Figure 4
Figure 4.Energy dispersive spectroscopy (EDS) spectrum for Area 1 in Figure 3.

The locations of the Ce Lα and Gd Lα peaks are emphasized. Note that the Cu signal is from the grid holding the sample.

Figure 5
Figure 5.Energy dispersive spectroscopy (EDS) spectrum for particle 1714.

One thousand counts at 10-keV full scale. (A) One thousand counts at 10,000-eV scan. The dashed-line box represents the range plotted on (B). Note that the Cu signal is from the support grid within the instrument. (B) One hundred fifty counts at 4,000–6,500-eV scale. The dashed-line box represents the range plotted on (C). (C) Forty counts at 5,000–6,200-eV scale.

Further enhancement of the EDS range of interest (40 counts in the 5,000–6,200-eV range) seems to resolve the Gd Lα peak (Figure 5C). Compared to the Cr Kα peak with +/−30 counts, though, the Gd Lα is barely significant, and both are dwarfed by the Fe Kα peak at nearly 800 counts (not plotted in the Figure 5C range). Resolution of the REE elements in an Fe-rich sample with accompanying Cr and Ti, both possible substitutions in the Fe spinel (magnetite), would not be possible without access to the raw data for the EDS scans. Basically, do not solely rely on the vendor software’s automatic peak identification; critical evaluation of possible and realistic element associations is always in order.

3.2. Particle 1724

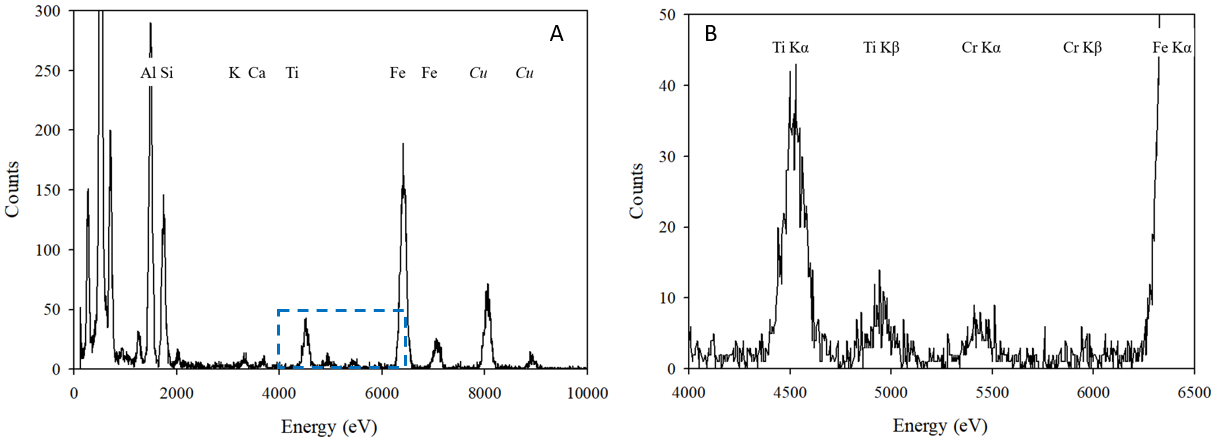
Particle 1724 (Figure 2) is dominated by Si- and Al-bearing glass with some Fe-rich areas (Figure 6). Close examination of a portion of the high-angle annular dark-field scanning TEM (HAADF-STEM) image, the Ce and Gd overlays, and the associated EDS spectrum (Figure 7) shows that, at this scale, the same issues plaguing the interpretation of particle 1714 are repeated here. As above, the locations of possible REE peaks overlap or are shadowed by larger Fe, Ti, and Cr (not shown at this scale) peaks. This is further highlighted by the redrafting of the full scale (up to 10,000 eV) and the plot of the 4,000–6,500-eV/50-count ranges on Figure 8. Notably, at the focused scale of Figure 8B, the Ti Kα, Ti Kβ, Cr Kα, Cr Kβ, and the large Fe Kα peaks dominate the locations of REE peaks. Neither Gd Lα, falling between the Cr Kβ and Fe Kα peaks, nor Pr Lα, on the right shoulder of Ti Kβ, can be identified with certainty. A Nd Lα signal, sufficiently significant in particle 1714, is lost in the noise in Figure 8B. Therefore, unlike particle 1714, the presence of REE in particle 1724 is an illusion; the hints of the presence of Ce and Gd (Figures 6 and 7) are false positives based on the overlap of their peaks with those of Ti, Cr, and Fe.

Figure 6
Figure 6.High-angle annular dark-field scanning transmission electron microscopy (HAADF-STEM) image of particle 1724 with element maps of Al, Si, Fe, Ce, and Gd.
Figure 7
Figure 7.

Left: High-angle annular dark-field scanning transmission electron microscopy (HAADF-STEM) image of particle 1724 with overlays of Ce and Gd (inset for Area 1). Upper right: Energy dispersive spectroscopy (EDS) spectrum for Area 1 in Figure 3. Note that the Cu signal is from the grid holding the sample. Lower right: Approximate element percentages for Area 1.

Figure 8
Figure 8.Energy dispersive spectroscopy (EDS) spectrum for particle 1724.

Three hundred counts at 10-keV full scale. (A) One thousand counts at 10,000-eV scan. The dashed-line box represents the range plotted on (B). Note that the Cu signal is from the support grid within the instrument. (B) Fifty counts at 4,000–6,500-eV scale.

3.3. Element interferences at the TEM scale

The complexities of TEM-EDS element maps are shown in Figure 9 (unpublished data from a 2019 re-examination of the samples studied in Hower et al. 2018). The REE-bearing mineral (monazite is dominant, but other phases, such as xenotime, are possible)/kaolinite/coal mix from the Fire Clay coal, Knox County, Kentucky shows the outline of the monazite by the P and Ce maps (Nd, not plotted here, has an identical pattern as the Ce map). The REE-bearing mineral is partially concealed by the kaolinite, so the Si map overlaps the P and Ce areas. Yttrium, though, has the appearance of being everywhere, even in the mounting epoxy, except with the coal. As indicated by the density of the Y signal, Y may be legitimately present in association with the REE-bearing mineral (although the P Kα and Kβ at 2.010 and 2.139 are close to the Y Lα and Lβ at 1.924 and 1.998), but its apparent association with Si could be a function of the proximity of the broad Si Kα and Kβ peaks and lesser intensity Y Lα and Lβ peaks. Only a search for the Y Kα peak (14.958 keV) would resolve any suspected association of Y with kaolinite. In this case, the abundance of Si in kaolinite and the subsequent dominance of the Si Kβ (1.837 keV) versus the Y Lα (1.924 keV) implies that, like the illusionary REE in particle 1724, a Y association with kaolinite is, at best, unproven.

Figure 9
Figure 9.Example of the complexities of elemental mapping showing the P, Ce, Si, and Y distributions in a rare earth element–bearing mineral (mz)/kaolinite/coal mix from the Fire Clay coal (unpublished data from a 2019 re-examination of the samples studied in Hower et al. 2018).

4. Summary

Although it does not seem likely that there are serious errors in the ICP-AES analyses (Section 2.1), the interpretation of EDS peaks can be misleading. The EDS detection of elements such as Gd and Pr in the tens of parts per million range against a background of elements in the hundreds of parts per million (Cr), 1–2% range (Ti), and >10% range (Fe) is a significant problem. The ability to examine narrow energy ranges with low counts (=low concentrations) is a tremendous help, but it cannot overcome the requirement to have the peaks significantly exceed the background (a 3× enhancement) in order to have confidence in their reality. The most significant signs of REE in carbons surrounding Al-Si particles in fly ash are in the determination of the lighter REE, such as Ce and Nd. In most fly ashes, the concentrations of Pr and Gd will be an order of magnitude less than those of Ce and Nd, too low to be identified with certainty with TEM-EDS.

Overall, although we know that REE, specifically Gd and Pr, are concentrated in association with the magnetic particles, the unresolved question is whether the association is just due to an incidental association with the Al-Si glass and/or carbon in the same particles as the magnetite, or to an actual differentiation more closely related to the magnetite.


Acknowledgments

This study was completed as part of U.S. Department of Energy contract DE-FE0027167. Access to characterization instruments and staff assistance was provided by the Electron Microscopy Center at the University of Kentucky, supported in part by the National Science Foundation/EPSCoR Award 1355438 and by the Commonwealth of Kentucky. This work used shared facilities at the Virginia Tech National Center for Earth and Environmental Nanotechnology Infrastructure (NanoEarth), a member of the National Nanotechnology Coordinated Infrastructure (NNCI), supported by the National Science Foundation (ECCS 1542100 and ECCS 2025151).

Submitted: March 08, 2022 EDT

Accepted: April 01, 2022 EDT

References

Ardini, Francisco, Francesco Soggia, Francesco Rugi, Roberto Udisti, and Marco Grotti. 2010. “Comparison of Inductively Coupled Plasma Spectrometry Techniques for the Direct Determination of Rare Earth Elements in Digests from Geological Samples.” Analytica Chimica Acta 678 (1): 18–25. https://doi.org/10.1016/j.aca.2010.07.036.
Google Scholar
Bank, T., E. Roth, P. Tinker, and E. Granite. 2016. “Analysis of Rare Earth Elements in Geologic Samples Using Inductively Coupled Plasma Mass Spectrometry.” Topical Report No. DOE/NETL-2016-1794. Washington, DC: U.S. Department of Energy.
Chen, Yuanzhi, Naresh Shah, Frank E. Huggins, and Gerald P. Huffman. 2004. “Investigation of the Microcharacteristics of PM2.5 in Residual Oil Fly Ash by Analytical Transmission Electron Microscopy.” Environmental Science & Technology 38 (24): 6553–60. https://doi.org/10.1021/es049872h.
Google Scholar
———. 2005. “Transmission Electron Microscopy Investigation of Ultrafine Coal Fly Ash Particles.” Environmental Science & Technology 39 (4): 1144–51. https://doi.org/10.1021/es049871p.
Google Scholar
Chen, Yuanzhi, Naresh Shah, Frank E. Huggins, Gerald P. Huffman, and A. Dozier. 2005. “Characterization of Ultrafine Coal Fly Ash Particles by Energy-Filtered TEM.” Journal of Microscopy 217 (3): 225–34. https://doi.org/10.1111/j.1365-2818.2005.01445.x.
Google Scholar
Fu, Biao, James C. Hower, Shifeng Dai, Sarah M. Mardon, and Guijian Liu. 2018. “Determination of Chemical Speciation of Arsenic and Selenium in High-As Coal Combustion Ash by x-Ray Photoelectron Spectroscopy: Examples from a Kentucky Stoker Ash.” ACS Omega 3 (12): 17637–45. https://doi.org/10.1021/acsomega.8b02929.
Google ScholarPubMed CentralPubMed
Fu, Biao, James C. Hower, Wencai Zhang, Guangqian Luo, Hongyun Hu, and Hong Yao. 2022. “A Review of Rare Earth Elements and Yttrium in Coal Ash: Content, Modes of Occurrences, Combustion Behavior, and Extraction Methods.” Progress in Energy and Combustion Science 88 (January): 100954. https://doi.org/10.1016/j.pecs.2021.100954.
Google Scholar
Hower, James C. 2012. “Petrographic Examination of Coal-Combustion Fly Ash.” International Journal of Coal Geology 92 (March): 90–97. https://doi.org/10.1016/j.coal.2011.12.012.
Google Scholar
Hower, James C., Debora Berti, Michael F. Hochella Jr., and Sarah M. Mardon. 2018. “Rare Earth Minerals in a ‘No Tonstein’ Section of the Dean (Fire Clay) Coal, Knox County, Kentucky.” International Journal of Coal Geology 193 (June): 73–86. https://doi.org/10.1016/j.coal.2018.05.001.
Google Scholar
Hower, James C., Uschi M. Graham, Alan Dozier, Michael T. Tseng, and Rajesh A. Khatri. 2008. “Association of the Sites of Heavy Metals with Nanoscale Carbon in a Kentucky Electrostatic Precipitator Fly Ash.” Environmental Science & Technology 42 (22): 8471–77. https://doi.org/10.1021/es801193y.
Google Scholar
Hower, James C., and John G. Groppo. 2021. “Rare Earth-Bearing Particles in Fly Ash Carbons: Examples from the Combustion of Eastern Kentucky Coals.” Energy Geoscience 2 (2): 90–98. https://doi.org/10.1016/j.engeos.2020.09.003.
Google Scholar
Hower, James C., John G. Groppo, Kevin R. Henke, Uschi M. Graham, Madison M. Hood, Prakash Joshi, and Dorin V. Preda. 2017. “Ponded and Landfilled Fly Ash as a Source of Rare Earth Elements from a Kentucky Power Plant.” Coal Combustion and Gasification Products 9 (1): 1–21. https://doi.org/10.4177/ccgp-d-17-00003.1.
Google Scholar
Hower, James C., John G. Groppo, Robert B. Jewell, John D. Wiseman, Tristana Y. Duvallet, Anne E. Oberlink, Shelley D. Hopps, et al. 2021. “Distribution of Rare Earth Elements in the Pilot-Scale Processing of Fly Ashes Derived from Eastern Kentucky Coals: Comparisons of the Feed and Processed Ashes.” Fuel 295 (July): 120562. https://doi.org/10.1016/j.fuel.2021.120562.
Google Scholar
Hower, James C., John G. Groppo, Prakash Joshi, Dorin V. Preda, David P. Gamliel, Daniel T. Mohler, John D. Wiseman, et al. 2020. “Distribution of Lanthanides, Yttrium, and Scandium in the Pilot-Scale Beneficiation of Fly Ashes Derived from Eastern Kentucky Coals.” Minerals 10 (2): 105. https://doi.org/10.3390/min10020105.
Google Scholar
Lin, Ronghong, Mengling Stuckman, Bret H. Howard, Tracy L. Bank, Elliot A. Roth, Megan K. Macala, Christina Lopano, Yee Soong, and Evan J. Granite. 2018. “Application of Sequential Extraction and Hydrothermal Treatment for Characterization and Enrichment of Rare Earth Elements from Coal Fly Ash.” Fuel 232 (November): 124–33. https://doi.org/10.1016/j.fuel.2018.05.141.
Google Scholar
Linak, William P., Jong-Ik Yoo, Shirley J. Wasson, Weiyan Zhu, Jost O.L. Wendt, Frank E. Huggins, Yuanzhi Chen, Naresh Shah, Gerald P. Huffman, and M. Ian Gilmour. 2007. “Ultrafine Ash Aerosols from Coal Combustion: Characterization and Health Effects.” Proceedings of the Combustion Institute 31 (2): 1929–37. https://doi.org/10.1016/j.proci.2006.08.086.
Google Scholar
McLennan, S. M., and S. R. Taylor. 1991. “Sedimentary Rocks and Crustal Evolution: Tectonic Setting and Secular Trends.” Journal of Geology 99 (1): 1–21. https://doi.org/10.1086/629470.
Google Scholar
Medvedev, Nickolay S., Anastasiya V. Shaverina, Alphiya R. Tsygankova, and Anatoly I. Saprykin. 2018. “Comparison of Analytical Performances of Inductively Coupled Plasma Mass Spectrometry and Inductively Coupled Plasma Atomic Emission Spectrometry for Trace Analysis of Bismuth and Bismuth Oxide.” Spectrochimica Acta Part B: Atomic Spectroscopy 142 (April): 23–28. https://doi.org/10.1016/j.sab.2018.01.017.
Google Scholar
Pan, Jinhe, Changchun Zhou, Cheng Liu, Mengcheng Tang, Shanshan Cao, Tingting Hu, Wanshun Ji, Yulin Luo, Mingzhong Wen, and Ningning Zhang. 2018. “Modes of Occurrence of Rare Earth Elements in Coal Fly Ash: A Case Study.” Energy & Fuels 32 (9): 9738–43. https://doi.org/10.1021/acs.energyfuels.8b02052.
Google Scholar
Pan, Jinhe, Changchun Zhou, Mengcheng Tang, Shanshan Cao, Cheng Liu, Ningning Zhang, Mingzhong Wen, Yulin Luo, Tingting Hu, and Wanshun Ji. 2019. “Study on the Modes of Occurrence of Rare Earth Elements in Coal Fly Ash by Statistics and a Sequential Chemical Extraction Procedure.” Fuel 237 (February): 555–65. https://doi.org/10.1016/j.fuel.2018.09.139.
Google Scholar
Park, Sungyoon, Minsoo Kim, Yejee Lim, Jimin Yu, Siyu Chen, Sang Woon Woo, Sunho Yoon, Sungjun Bae, and Han S. Kim. 2021. “Characterization of Rare Earth Elements Present in Coal Ash by Sequential Extraction.” Journal of Hazardous Materials 402 (January): 123760. https://doi.org/10.1016/j.jhazmat.2020.123760.
Google Scholar
Ribeiro, Joana, Kátia DaBoit, Deolinda Flores, Marcio A. Kronbauer, and Luis F.O. Silva. 2013. “Extensive FE-SEM/EDS, HR-TEM/EDS and TOF-SIMS Studies of Micron- to Nano-Particles in Anthracite Fly Ash.” Science of the Total Environment 452–453 (May): 98–107. https://doi.org/10.1016/j.scitotenv.2013.02.010.
Google Scholar
Silva, Luis F.O., Kátia DaBoit, C. Serra, S.M. Mardon, and James C. Hower. 2010. “Fullerenes and Metallofullerenes in Coal-Fired Stoker Fly Ash.” Coal Combustion & Gasification Products 2: 66–79.
Google Scholar
Silva, Luis F.O., André Jasper, Maria L. Andrade, Carlos H. Sampaio, Shifeng Dai, Xiao Li, Tian Li, et al. 2012. “Applied Investigation on the Interaction of Hazardous Elements Binding on Ultrafine and Nanoparticles in Chinese Anthracite-Derived Fly Ash.” Science of the Total Environment 419 (March): 250–64. https://doi.org/10.1016/j.scitotenv.2011.12.069.
Google Scholar
Veranth, J.M, T.H Fletcher, D.W Pershing, and A.F Sarofim. 2000. “Measurement of Soot and Char in Pulverized Coal Fly Ash.” Fuel 79 (9): 1067–75. https://doi.org/10.1016/s0016-2361(99)00250-1.
Google Scholar
Wang, Zhen, Shifeng Dai, Jianhua Zou, David French, and Ian T. Graham. 2019. “Rare Earth Elements and Yttrium in Coal Ash from the Luzhou Power Plant in Sichuan, Southwest China: Concentration, Characterization and Optimized Extraction.” International Journal of Coal Geology 203 (February): 1–14. https://doi.org/10.1016/j.coal.2019.01.001.
Google Scholar
Wilcox, Jennifer, Beibei Wang, Erik Rupp, Ross Taggart, Heileen Hsu-Kim, Marcos L. S. Oliveira, César M. N. L. Cutruneo, et al. 2015. “Observations and Assessment of Fly Ashes from High-Sulfur Bituminous Coals and Blends of High-Sulfur Bituminous and Subbituminous Coals: Environmental Processes Recorded at the Macro- and Nanometer Scale.” Energy & Fuels 29 (11): 7168–77. https://doi.org/10.1021/acs.energyfuels.5b02033.
Google Scholar
Yang, Yi, Bo Chen, James Hower, Michael Schindler, Christopher Winkler, Jessica Brandt, Richard Di Giulio, et al. 2017. “Discovery and Ramifications of Incidental Magnéli Phase Generation and Release from Industrial Coal-Burning.” Nature Communications 8 (1): 194. https://doi.org/10.1038/s41467-017-00276-2.
Google ScholarPubMed CentralPubMed
Zygarlicke, C.J., B.C. Folkedahl, C.M. Nyberg, I.K. Feole, B.A. Kurz, N.L. Theakar, et al. 2019. “Rare-Earth Elements (REES) in U.S. Coal-Based Resources: Sampling, Characterization, and Round-Robin Interlaboratory Study.” National Energy Technology Laboratory. https://edx.netl.doe.gov/dataset/rare-earth-elements-in-u-s-coal-based-resources,rfp-10982-fe0029007-final-report-RRIS-UND.pdf.

Powered by Scholastica, the modern academic journal management system