

1. Introduction
Carbon-based products are at the forefront of technological development. Examples include activated carbon for water and gas purification, carbon and lamp black found in the printing industry, synthetic graphite for electrodes and lubricants, and carbon-carbon composites in the aviation and space sciences (Pierson 1993). Unburned carbon found in coal conversion ash may be a suitable source of carbon for some of these applications. In particular, the production of synthetic graphite requires attention, since natural graphite is considered a scarce commodity and therefore any synthetic alternative is desirable (European Commission 2017).
More than 780 million tonnes of coal conversion ash are produced annually worldwide, with more than 34 million tonnes produced in South African alone (Heidrich, Feuerborn, and Weir 2013; Reynolds-Clausen and Singh 2017). A large proportion of the ash finds application in the cement and concrete industries, where ASTM regulation restricts the unburned carbon percentage to a maximum of 6 wt. % LOI to prevent adsorption of air-entraining agents (ASTM C618-17a). Industrial separation processes exist for the lowering of the LOI levels in ash, such as dry electrostatic separation (Bittner et al. 2014). However, to extract the unburned carbon for use in synthetic graphite production, the process is far more complicated due to the typical low carbon-in-ash percentages and the high grades / recoveries needed for usage. LOI percentages in South African power utility ash range between 0.4 to 7.8 wt. % and Matjie et al. (2005; 2008) reported LOIs of 5, 5.8, and 8.2 wt. % for South African gasification ash.
This paper focuses on the extraction of unburned carbon from fly ash, bottom ash and gasification ash from select South African utilities, using a combination of techniques to increase the efficiency and effective separation of the unburned carbon from the mineral component. The aim was to produce a carbon rich fraction which can be used as a precursor for synthetic graphite and subsequently immobilized on electrode surfaces and tested in energy-related reactions such as the hydrogen evolution reaction (HER), oxygen evolution reaction (OER), oxygen reduction reaction (ORR), and water splitting (simultaneous H2 and O2) reactions. For this reason, a dry method is needed where the unburned carbon pores cannot be occluded. Therefore, separation techniques such as froth flotation, oil agglomeration, and sink-float using other liquids than water were not suitable. A dry scheme consisting of size, electrostatic, and magnetic separation was thus used. Take note that the methods used were not novel. However, the designing and assessing of the separation process for this specific batch of samples and for this specific end-use are novel. Ideally, 90 wt. % LOI was sought with a high carbon recovery.
2. Methods
2.1 Samples and preparation procedures
Fly ash, bottom ash, and gasification ash were supplied in 2016 by two South African combustion utilities and one gasification utility (Table 1), following in-house sampling procedures based on ISO 13909-2: 2016. The samples provide a snapshot in time of the ash produced by the utility. The feed coal to the combustion and gasification processes is Medium Rank C bituminous, typically poor in vitrinite (below 30%) and high in mineral matter (ash contents above 20%), originating from the Witbank and Highveld Coalfields.
The bulk ash samples were air-dried and divided into smaller, representative fractions. A representative sample from each parent ash was characterised in detail, and the remainder of the sample was utilised in the separation trials. Due to the coarser sizes of the bottom and gasification ash samples, these samples were pulverised before characterisation commenced.
2.2 Sample characterisation
The mineralogical compositions of the ash samples were determined by XRD. A PANalytical Empyrean diffractometer with PIXcel detector and fixed slits with Fe filtered Co-Kα radiation was used for detection, and the X’Pert Highscore plus software was used for phase identification. The Rietveld method was used to semi-quantify the data, and the amorphous percentages were determined by adding a 20 % Si standard to the samples.
The LOI analysis was conducted by MAK Analytical South Africa. The samples were heated in an oxidised atmosphere to 500 °C, maintaining this temperature for 30 minutes before being heated to 815 °C. The samples were kept at 815 °C for 60 minutes before the mass loss was determined. Converting the mass loss to a percentage provides the LOI value.
Petrography enabled the visible assessment of the mineral-carbon associations in the carbon-ash particles. The samples were crushed to <1 mm (where necessary), mounted in epoxy resin, and polished according to ISO 7404 part 2. A Zeiss Imager M2M reflected light microscope with an oil immersion objective and a combined magnification of ×500 was used.
2.3 Separation trials
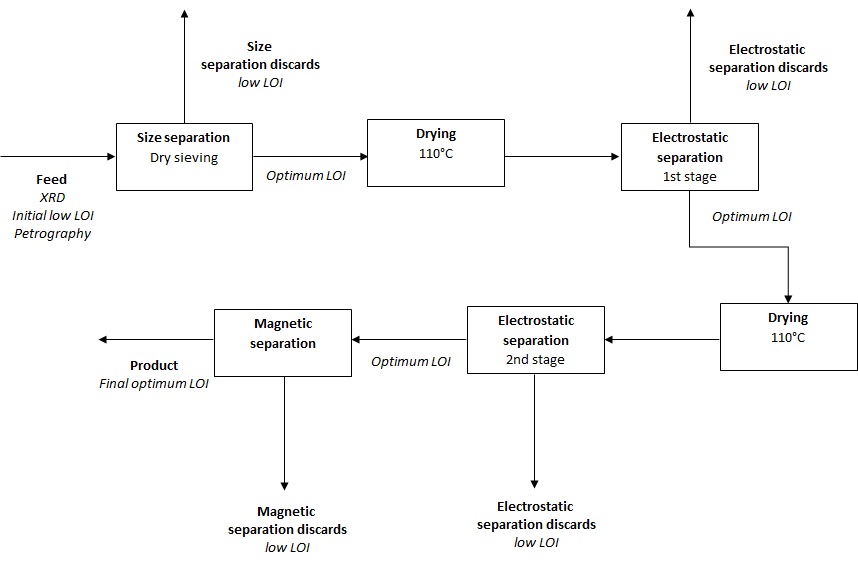
A schematic of the separation stages followed is provided in Figure 1.

A dry sieving technique was used to separate the ash samples into different size fractions using three different sieve columns: Fly ash: 38, 53, 75, 106, 150, 212 µm; Bottom ash: 75, 150, 300, 600, 1000, 2000 µm; and Gasification ash: 150, 300, 600, 1000, 2000, 5000 µm. The sieve stack was loaded with 150 g of sample, and mechanically sieved for 20 minutes. The LOI for each size fraction was obtained to determine the inferred carbon purity of the product. Fractions with high LOIs were selected for further separation of the ash and carbon. Particle size separation allows to find the carbon richest size fraction, and to discard a large amount of sample with a low carbon content.
After the sieving trials, selected size fractions were dried overnight (110 °C) in a drying oven before electrostatic separation commenced, to ensure the removal of excess moisture as this is known to reverse particle charge and cause inefficient separation (Baltrus et al. 2002). A CoronaStat, situated at the University of Pretoria, was used for electrostatic separation. The rotor speed was kept constant at 40 rpm. The voltage control was tested at 10 kV, 15 kV, and 20 kV respectively. The CoronaStat had five collection bins to collect the conductive (C), middlings 1 (M1), middlings 2 (M2), middlings 3 (M3), and non-conductive (NC) particles. The bins with the highest LOIs were selected and passed through the electrostatic separator a second time, under the same conditions, to improve the carbon grades. Triboelectrostatic separation is more sensitive than a CoronaStat electrostatic separator in the separation of minerals with small differences in their electron voltages (Bada, Falcon, and Falcon 2010). This technology might thus be more efficient at separating unburned carbon from ash (Ban et al. 1997; Gray et al. 2002; Maroto-Valer, Taulbee, and Hower 1999; Soong et al. 2002). However, a triboelectrostatic separator was unavailable during the experimental phase of this paper and therefore the use of a CoronaStat.
The bins with the highest LOIs were then selected for magnetic separation. A Frantz dry magnetic separator was used and the magnetic intensity was varied at 0.5 A, 1.0 A, and 1.5 A. Although not a commonly used technique, it was found by the authors that magnetic separation can remove large amounts of magnetic material from the unburned carbon product. The magnetic fraction can also subsequently be used in value-added applications e.g. as catalyst.
2.4 Assessment of separation efficiency
Carbon grade, carbon recovery, and sample yield were used (cumulative basis) (Equations 1 to 3) to assess the separation efficiency. Carbon grade indicates the purity of the product stream. LOI was used to determine the carbon grade. Although LOI is a rough estimate of unburned carbon, it is a fast and simple process compared to other carbon determination techniques such as total carbon, carbon speciation, and a microscopic count (Brown 1995; Fan and Brown 2001; Mohebbi, Rajabipour, and Scheetz 2015). Carbon recovery is an indication of how much of the initial carbon mass ended up in the carbon product. Sample yield is an indication of how much of the initial sample mass ended up in the carbon rich product.
3. Results and Discussion
3.1 Parent sample characterisation
The mineralogical and LOI results are presented in Table 2.
The ash is dominated by quartz and glassy amorphous phases, with relatively high mullite contents. The low LOI values pose possible challenges to obtaining a high grade carbon product with a suitable recovery.
A microscopic image of a typical carbon particle found in the ash is provided as Figure 2.

Minerals (mainly amorphous glass, quartz, and clays) are finely disseminated and appear interwoven in the carbon matrix. This intimate association is most likely related to the inertodetrinite - silicate relationship typically found in the Witbank - Highveld feed coals. Inertodetrinite represents small (<10 µm), detrital carbon, and is usually embedded with finely dispersed quartz and clay minerals (Wagner, Malumbazo, and Falcon 2018). To determine whether milling would liberate the carbon, image analysis was applied using a technique proposed by Dorland et al. (2015). It was found that if milling at a size of 20 µm took place, the smaller particles would remain high in mineral matter, essentially a replicate of the original particle. This is referred to as the “mini-me” effect and makes milling in this case impractical (McMillan et al. 2015).
3.2 Particle size separation
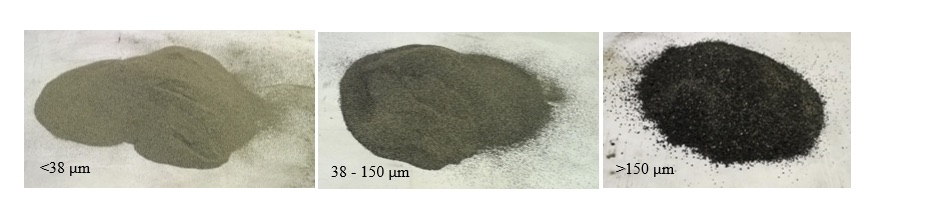
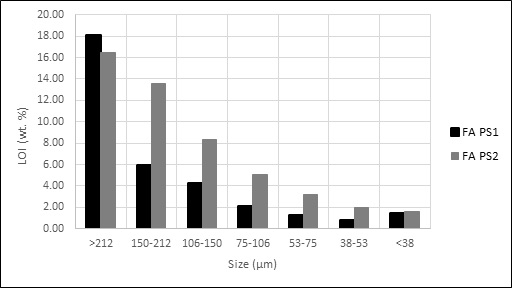
During particle size distribution (PSD) determination, it was noted that the coarser fractions of the fly ash samples were darker in colour than the lower-size fractions (Figure 3). Hence, the coarser fractions are enriched in carbonaceous particles relative to the finer fractions, which is corroborated by the LOI percentages of the fly ash samples that increase with an increase in particle size (Figure 4). Hurt and Gibbins (1995), Külaots et al. (2004), and Lu et al. (2007) found similar results for their separated fly ash samples. As volatile matter evolves, the vitrinite and reactive semifusinite in the coal become plastic, swell and harden as larger porous char. The macerals in the inertinite dominant particles devolatilise more selectively with limited pore development, forming large mixed porous chars. Some of these large chars are not completely consumed during the combustion process and therefore report to the ash as large carbon particles.


No visible trends were apparent with regards to the bottom and gasification ash samples in terms of carbon content and particle size distribution. Thus, size separation was suitable as a pre-concentration step for the fly ash samples only. However, in order to use the CoronaStat, particles larger than 600 µm in the bottom ash sample were discarded, losing only 15 % of the initial carbon. For the gasification ash sample, the material loss would have been too great if particles larger than 600 µm were discarded; hence, the gasification ash was manually milled to a top size of 600 µm.
The carbon recoveries and sample yields for the fly ash samples were used to determine the size cut-points (Figure 5).

The chosen cut-point for FA PS1 was 150 µm, and for FA PS2 it was 75 µm. At these cut-points, the highest grades could be reached without losing too much of the carbon. Hence, all particles larger than 150 μm and 75 µm respectively were used in the subsequent concentration trials. Splitting at the chosen cut-points resulted in doubling the grades, removing the bulk of the sample (yield), whilst at the same time keeping the bulk of the carbon (recovery) (Table 3).
3.3 Electrostatic separation
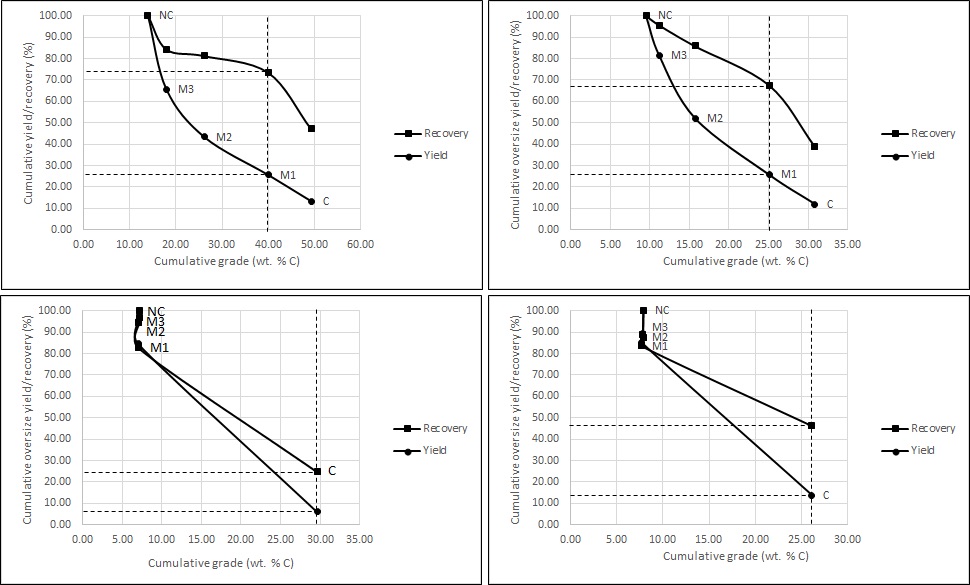
A voltage setting of 20 kV gave the best results for the fly ash samples. For the bottom and gasification ash samples a voltage setting of 15 kV was sufficient. In Figure 6 the cumulative grades, recoveries, and yields are given. Bins C (conductive) and M1 (middlings 1) for FA PS1 and FA PS2 provided similar recoveries and yields, and the grades almost tripled their value from the previous size separation stage (Table 3). If only bin C was kept, the grades would have increased substantially but the recoveries would have been very low.
For the bottom and gasification ash samples, it is very clear that the grades for M1, M2 (middlings 2), M3 (middlings 3), and NC (non-conductive) are more consistent, and only the conductive fraction shows a change in grade. However, the recoveries are very low for this fraction (Table 3).
The selected cut-point fractions were recycled through the electrostatic system again to give the particles a second chance to separate. For the fly ash samples, the Bins C and M1 fractions were once again separated, whilst for the bottom and gasification ash samples only the conductive fraction was used (Table 3). All grades increased when recycled. The most substantial increase was seen for BA PS4. However, the carbon recoveries for the fly ash samples are much higher when compared to the recoveries for the bottom and gasification ash samples.

The electron voltage of carbon is 4eV and that of Al-Si minerals (glass) 4.7-5eV (Soong et al. 1998). Triboelectrostatic separation is more sensitive than a CoronaStat electrostatic separator in the separation of minerals with small differences in their electron voltages (Bada, Falcon, and Falcon 2010). This technology might thus be more efficient at separating unburned carbon from ash. Maroto-Valer et al. (1999) used size separation in combination with triboelectrostatic separation to obtain carbon grades ranging between 88 and 91 vol. % starting from parent fly ash samples with carbon grades ranging between 36 – 39 vol. %. Soong et al. (2002) increased their initial fly ash carbon grades (12 and 14 wt. %) to a maximum of 60 wt. % carbon by using a combination of size and triboelectrostatic separation. Gray et al. (2002) used a double stage triboelectrostatic separation process to obtain a 35 wt. % carbon product from an 18 wt. % carbon fly ash sample. Their carbon recovery was below 50 %. Ban et al. (1997) used a triboelectrostatic separator to obtain carbon products with grades of up to 50 wt. % and recoveries > 50 % from fly ash samples. Unfortunately, a triboelectrostatic separator was not available during the experimentation phase of this study, and therefore its effect on the samples used in this paper is unknown.
3.4 Magnetic separation
According to Valentim et al. (2016), magnetic material in ash is present as massive or dendritic ferrospheres and as finely dispersed crystals trapped in glassy phases. As a result, a magnetic separation stage was added to the existing separation scheme. Results are included in Table 3. For the fly ash samples, it was found that increasing the magnetic intensity above 0.5 A resulted in a significant drop in recovery without any increase in grade. For the gasification ash sample, it was found that at 0.5 A a very low grade but a high recovery was obtained. The magnetic intensity for this sample was therefore increased to 1.5 A. Although the grades increased for the fly ash samples during the magnetic separation step, the carbon recovery for FA PS2 is much lower than for FA PS1. For the bottom and gasification ash samples, the grades did not increase substantially, even after increasing the magnetic intensity. The reason is unclear, seeing that the magnetic fractions in the form of hematite and magnetite are similar for the four samples (Table 2).
4. Conclusion
A dry method for the separation of unburned carbon from coal conversion ash was developed and assessed on fly ash, bottom ash, and gasification ash samples obtained from various South African utilities. The aim was to obtain a carbon-rich fraction that can be used in a pre-graphitisation process as a potential replacement for natural graphite. The formed synthetic graphite will subsequently be used in green energy applications. Ideally a carbon grade of 90 wt. % was sought. The dry separation steps included sizing, electrostatic (CoronaStat), and magnetic separation. The final (overall) carbon grades, carbon recoveries, and yields are provided in Table 3. The grades increased significantly from the parent samples. Although FA PS1 produced the highest final grade (65.74 wt. %), FA PS2 produced the largest increase with an initial grade of 4.01 wt. % and a final grade of 56.55 wt. %. The grade for GA East is the lowest at 45.10 wt. %.
The overall recoveries are relatively low, possibly related to the unliberated nature of the carbon component. From the microscopic analysis it was observed that the ash minerals were finely disseminated in the carbon structure and had a “mini-me” arrangement; meaning that even after milling the smaller particles would remain high in mineral matter, essentially a replicate of the original particle. This excluded milling as an option for mineral liberation. Ultrasonic treatment was applied to see if the inclusions can be “shaken” loose, but this was not successful.
The 90 wt. % grade target was not reached and further experimentation was conducted. This included density separation (sink-float) on FA PS1, and a final LOI of 82.91 wt. % was achieved. Take note that the quartz content for this sample was exceptionally high (Table 2), and seeing that quartz is very dense (compared to other phases in ash) the density separation was efficient. The recovery, however, was very low. However, due to the usage of the carbon product in green energy applications, the carbon pores cannot be occluded and density separation is thus not feasible.
Acknowledgements
This work forms part of the 3rd ERA-MIN Joint Call (2015) project CHARPHITE, a collaboration between Portugal, Romania, Argentina, Poland, Spain, and South Africa and the authors would like to acknowledge the different inputs from the different partners.
This work is based on research supported by the National Research Foundation of South Africa (Grant number 103466) and the DST-NRF ERA-MIN grant for the Charphite project. The authors also acknowledge DST-NRF Centre of Excellence for Integrated Mineral and Energy Resource Analysis (CIMERA) for additional financial assistance;
Fundação Ciência e Tecnologia (ERA-MIN/0005/2015); Institute of Earth Sciences (ICT; FCT UID/GEO/04683/2013); COMPETE POCI-01-0145-FEDER-007690;
K.S. Viljoen acknowledges financial support from the South African Department of Science and Technology through their Research Chairs initiative (Geometallurgy), as administered by the National Research Foundation.
The author A.C. Santos benefited a PhD scholarship financed by FCT – Fundação para a Ciência e Tecnologia, Portugal, Ref: SFRH/BD/131713/2017.